Week by Week: TACC ICERT REU
June 12

Two weeks ago, I arrived for my research experience in Austin. Since then, I have undergone a week of training, met with my research faculty mentor and graduate student mentor, started my research, and attended the first Vis Lab workshop. This is my first experience working full time, so I feel pretty busy, but definitely in a good way.
This summer I have the opportunity to teach myself R, a programming language used mainly to analyze statistics and data sets. Although we had a small training session on R at TACC during the first week, I have had to teach myself a lot which has been pretty fun. My first task was to calculate some numbers given 106 different Excel sheets. Writing the R script wasn't too bad, because of its similarities to other programming languages that I already knew, but because of how the files were organized, it was going to be difficult to run the script on all of the data sheets. I had a bit of moving around to do. As a programmer, it would be silly to change the name of 106 files, and then move them to a different directory manually, so I wrote my first bash script to do all of this for me. This made it easy for me to run my R script on all of the files that were now located in one directory and compile my results into 1 new spreadsheet.
Well that was my first couple weeks in a nutshell. So far, I love UT, I love Austin, and I love my research.
June 23
There is a lot of reading involved in the research process. It never really occurred to me how scientists get ideas to start their work or where they get supplementary material. My graduate mentor showed Web of Science; it is an online database for scientific books, papers, articles, reviews, etc. I used it to help me grow more accustom to the language used in the lab and to help prepare myself for any questions that are asked when I present my poster. I always hated the research process for writing history papers; however its so different with science and a much more enjoyable process. Rather than reading about events that have already happened, you are able to read the latest publishings and what contributions people from around the world are making in different areas of science. I can't believe that after this week, the REU will be half over. Time flies!
July 1
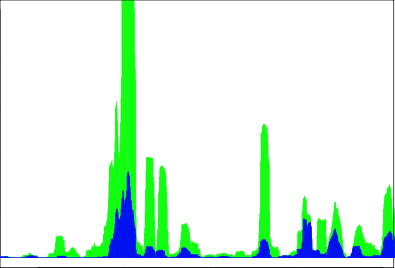
This week I taught myself how to use Shiny, a web application framework that uses R. Shiny makes it super easy to create interactive graphs and charts. It was difficult to get the hang of at first, but after playing around with it for a few days, it became extremely simple to create interactive visuals. With the large amounts of data that I have to process for my research team, it is difficult to spot any trends by just looking at a table of data. It's nearly impossible for people to just look at a large set of numbers and spot patterns right off the bat, but visuals make it simple for almost anyone to comprehend data. To the left is a portion of one of the output graphs that I created. Additionally, on the user interface, there is a slider bar that allows the user to choose the range on the x-axis that he or she is interested in and a text box that allows for numeric input to change the range visible on the y-axis. The overall visual created using R (without limiting the x and y ranges) has an x-axis range of over 2 million. However, by using Shiny I am able to look at the significant portions of the graph just by sliding a bar or changing the number in a text box. Hopefully this will help my research group to find trends in their data; either way, creating these visuals helped me to expand my knowledge of R and it's applications.
July 5
My research team really liked the visual aspects of Shiny and decided that having tools that visualized their data in such a way would be extremely useful to them. Once I leave, they will still have a way to analyze data just by changing the input values on the interface, rather than running code from the command line, saving a lot of time. The main focus of my project has shifted to finding conditions to place on a transcriptome data that will result in a list of regions that could potentially have an sRNA within them. The goal would be for this algorithm to work on a number of different organisms. I am currently working on creating a Shiny application that compares expression levels in a particular bacterium to see what conditions will give us the expected results. A visualization for this will be extremely helpful in finding what conditions should be place on the transcriptome data in our final algorithm that is expected to produce results for a number of different organisms.
July 13
My Shiny application is proving to be extremely helpful and is outputting results that are helping us to better analyze the data that we have and figure out which conditions will be most prevalent. I started to think more about my poster presentation last week and it turns out, much like this blog, that I won't be able to discuss a lot of information regarding the project due to it not yet being published. This is going to make it difficult for me to create an interesting poster and even more difficult to discuss my poster with the general audience and judges without disclosing any information that I shouldn't. I need to find a way to discuss my topic generally that will give me enough information to discuss what I am working on. My main focus for the rest of my time here is making sure that my tools are easy for the lab to use once I have left. I am taking the code that I worked on during my first week in the lab and making it more functional so that hopefully it can just be thrown into a bash script when it is time for the pipeline to be constructed. I am also working on user guides that will help my team to use all of the tools that I have made during my time here. I can't believe that there are only 2 weeks left until we will be at the XSEDE conference.
July 23
I'm a little late updating the blog this week, but that's because I've been crazy busy trying to finish everything up! This week involved finishing my poster, working on user guides and supplementary material to leave my research team, and starting my final report. There has not been a dull moment. I printed my poster today, however I haven't seen it yet. I'm really proud of how it looks on my computer screen and can't wait to see the printed version tomorrow when we practice presenting them. I can not believe XSEDE is next week already. I am excited for my first conference and first poster presentation. Although I wasn't too crazy about my topic when I first started working on it, I have become extremely proud of everything I've done and I'm excited to share my work with others. I learned two things this week. 1. You should keep really good notes and documentation of everything you are working on as you do it. I am spending so much time creating user guides for the lab so that they can use the tools I created after I leave. I really want them to be able to easily use and alter what I worked on this summer. 2. I'm extremely OCD when it comes to creating a poster. It's a process getting everything to look exactly how you want it to and fitting everything on it. The first version of my poster had far too many words on it and I hated it, (I realized this yesterday morning) so I spent one and half work days perfecting it from there. It takes way longer than I thought it would. I started last Wednesday hoping I could just work on a little bit at a time to have it done by early this week. However, I spent this whole week constantly messing with it until I sent it off to be printed. I maybe took 2 or 3 hours working on my final report. The rest of the time I was stressing over how I could make my poster better (that's approximately 24 hours). Hopefully it paid off.
